4/5 on 70+ Reviews: Superprof

4/5 on 70+ Reviews: Superprof

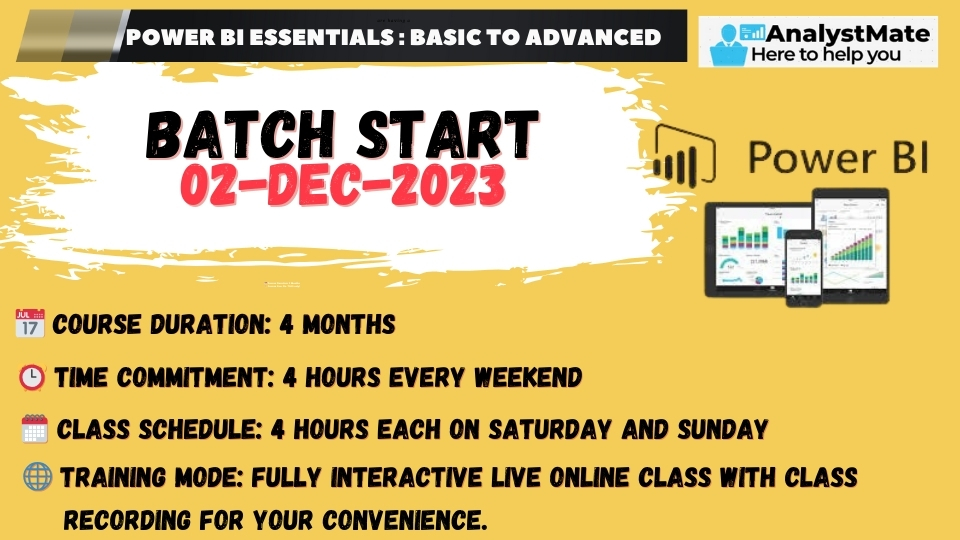
4-month live training, 6 hours per weekend (3 hours each on
Saturday and Sunday)
Training mode: Fully Interactive Live Online class with class
recording
With the help of our Power BI Advanced Analystmate course,
realise the complete potential of your data. Explore the depths
of analytics, data visualisation, and business intelligence. Our
extensive programme will improve your Power BI skills regardless
of your degree of expertise as an analyst.
With the help of our extensive Power BI Advanced Analystmate
course, unleash the power of data. Learn about advanced data
modelling, DAX functions, and Power Query in this programme to
improve your analytics skills. Our knowledgeable educators lead
you through real-world projects so you may get practical
experience creating powerful dashboards and reports.
Participate in discussion boards, network with colleagues, and engage in a collaborative learning environment. Get ongoing assistance and remain current on Power BI trends. Whether you're a novice or an experienced analyst, our Power BI Advanced Analystmate course will help you advance your career with its comprehensive insights.
This course is designed to take you from a beginner
to an advanced user of Power BI.
Whether you are aspiring Data analyst, Power BI
Developer looking to unlock the power of data, this
course will provide you with the skills needed to
create impactful reports and dashboards.
We designed our training sessions carefully to be
super-efficient. Your time is precious, and so is
ours. Our aim is to get you job ready in the
quickest time possible
Prerequisite: Prior knowledge of Excel is beneficial
for learning Power BI but not strictly needed.
Section 1: Introduction to Power Bi
Section 2: Data Sources and Connectors
Section 4: Power BI Basics: Power Query, Modeling,
and DAX
Section 5: Power BI Visuals
Section 6: Power Query: Transforming & Shaping
Data
Section 6.1: Transforming & Shaping Data
Section 6.1.1: Transform Table
Section 6.1.2: Transform Columns
Section 6.1.3: Combine Data
Section 6.1.4: Split Columns
Section 6.1.5: Text Formatting Functions
Section 6.1.6: Extracting Text
Section 7: Data modeling in Power BI
Section 8: Data Analysis using DAX Functions
Section 8.1: Introduction to (DAX)
Section 8.2: DAX Aggregate Functions
Section 8.3: Counting Function Dax
Section 8.4: Logical Functions
Section 8.5: DAX Text Functions
Section 8.6: DAX Date Functions
Section 8.7: Advanced DAX Functions
Section 8.8: Time Intelligence Functions
Section 8.9: Advanced DAX Concepts
Section 8.10: CALCULATE and CALCULATETABLE
Functions
Section 8.12: Filter Functions (context modification
in DAX)
Section 8.13: Table Functions
Section 9: Introducing Power Bi Service
Section 9.1: Connecting to Data
Section 9.2: Administering the Power BI
Service
Section 9.3: Refresh Schedules & Content
administration
Section 9.4: Sharing Administration
Section 9.14: Building Paginated Reports
Section 10: Integrating AI and Machine Learning with
Power BI
Section 11: dax query
Section 12: Power Bi Hands-on Real-World Projects
list
Section 13: Power Bi Interview Essentials.
SECTION 1: INTRODUCTION TO POWER BI
Introduction to Power BI - Need, Importance
History - Power View, Power Query, Power
Pivot
Power BI Installation and Cloud Account
Power BI Cloud and Power BI Service
Power BI Architecture and Data Access
Power BI Desktop - Instillation, Usage
Take a quick tour of the Power BI interface.
Understanding Power BI Report Designer
Report Canvas, Report Pages: Creation, Renames, View
Options: Full, Fit Page, Width Scale
Report Visuals, Fields and UI Options, Focus Mode,
Explore and Export Settings
Power BI Cloud Account Configuration
Course Plan - Power BI Online Training
SECTION 2: DATA SOURCES AND CONNECTORS
Explore various data connectors and their
types
Connect to a variety of data sources, databases,
Excel files, and cloud storage services
Direct Query Options and Real-time (LIVE) Data
Access Connecting to SharePoint folders
SECTION 4: POWER BI BASICS: POWER QUERY, MODELING,
AND DAX
Create and use calculated columns and
measures
Basic data transformation using power query
CALCULATE Fundamental function for context
modification
SECTION 5: POWER BI VISUALS
Work with advanced features like drill-through,
bookmarks, and custom tooltips
Create a variety of charts and graphs, including bar
charts, line charts, pie charts, and more
Explore themes for report design
Manage roles, apply conditional formatting, and
configure small multiples
Visual-Level Filters and Format Options
Page Level Filters and Report Level Filters
Page-Level Filters and Column Formatting,
Filters
Report Fields, Formats and Analytics
SECTION 6: POWER QUERY: TRANSFORMING & SHAPING
DATA
Authentication with a data source and Manage
connections
Get data in Power BI Desktop
SECTION 6.1: TRANSFORMING & SHAPING DATA
Promote or demote column headers
SECTION 6.1.1: TRANSFORM TABLE
Choose or remove columns
Filter a table (Text Filter, Number Filter and by
row position)
Pivot and Unpivot columns
Grouping or summarizing rows
Data types in Power Query Dealing with errors in
Power Query
Transpose a table and Reverse rows
SECTION 6.1.2: TRANSFORM COLUMNS
Working with duplicate values
Sort columns and Rename columns
Fill values in a column
Replace values and errors
Move columns
Add an index column
Add a column from examples
Add a conditional column
Add a custom column
Append queries
SECTION 6.1.3: COMBINE DATA
Merge queries
Combine Files
SECTION 6.1.5: TEXT FORMATTING FUNCTIONS
SECTION 6.1.4: SPLIT COLUMNS
SECTION 6.1.6: EXTRACTING TEXT
SECTION 7: DATA MODELING IN POWER BI
Modeling view user interface
Hide table and column form Data model
Display Folder
Understanding Of Dimension table & Fact
table
Star schema data models
Types of cardinalities Managing relationships in
Power BI
SECTION 8: DATA ANALYSIS USING DAX FUNCTIONS
SECTION 8.1: INTRODUCTION TO (DAX)
Overview of Data Analysis Expressions (DAX)
Create and use calculated columns and
measures
Understanding the Importance of Data Modeling and
Data Visualization
Filter Context & Row Context
SECTION 8.2: DAX AGGREGATE FUNCTIONS
Introduction to DAX Aggregate Functions
CALCULATE Fundamental function for context
modification
SUM, SUMX, MIN, MAX, and AVERAGE Functions
SECTION 8.3: COUNTING FUNCTION DAX
COUNT, COUNTA, COUNTAX, COUNTROWS, COUNTX,
COUNTBLANK & DISTINCTCOUNT
SECTION 8.4: LOGICAL FUNCTIONS
Introduction to Logical Functions: AND, OR, NOT, IF,
IFERROR, TRUE, False
SECTION 8.5: DAX TEXT FUNCTIONS
Text Functions: COMBINEVALUES, SEARCH, FIND, EXACT,
and TRIM
CONCATENATE, REPLACE, LEFT, RIGHT, MID, LEN,
SUBSTITUTE, FIXED, and FORMAT
SECTION 8.6: DAX DATE FUNCTIONS
Date Functions: MINUTE, HOUR, DAY, MONTH, QUARTER,
YEAR, EDate, EOMonth
WEEKDAY, WEEKNUM, DATE, TODAY, NOW, CALENDAR, and
CALENDAR AUTO
SECTION 8.7: ADVANCED DAX FUNCTIONS
MAX, MAXA, MAXX
FIRSTNONBLANKVALUE, LASTNONBLANKVALUE
GENERATESERIES, EXCEPT, All, ALLEXCEPT ALLSELECTED,
SELECTEDVALUE, VALUE, ERROR, IN, UPPER,
LOWER
PARENT, CHILD, PARALLELPERIOD, TopN, GROUPBY
SECTION 8.8: TIME INTELLIGENCE FUNCTIONS
TOTALYTD, TOTALQTD, TOTALMTD
DATESYTD, DATESQTD, DATESMTD
SAMEPERIODLASTYEAR, PARALLELPERIOD, PREVIOUSMONTH,
NEXTMONTH
DATEDIFF, DATESBETWEEN, DATESINPERIOD,
DATEADD
SECTION 8.9: ADVANCED DAX CONCEPTS
Dynamic URLs and Dynamic Data
DAX CONTAINSSTRING & CONTAINSSTRINGEXACT
DAX IN, DAX CONTAINSROW, and Overview of DAX
Operators
FILTER Context in Power BI
CROSSFILTERING and Relationship Management
SECTION 8.10: CALCULATE AND CALCULATETABLE
FUNCTIONS
Understanding DAX CALCULATE and DAX
CALCULATETABLE
Counting Working Days between Two Dates
Lookup for Multiple Values in a Table
SECTION 8.12: FILTER FUNCTIONS (CONTEXT MODIFICATION
IN DAX)
ALL, ALLEXCEPT, ALLSELECTED, KEEPFILTERS,
REMOVEFILTERS, CALCULATE
VALUES, DISTINCT, RELATEDTABLE
USERELATIONSHIP, EARLIER, FILTER
SECTION 8.13: TABLE FUNCTIONS
SUMMARIZE, SUMMARIZECOLUMNS
RELATED, RELATEDTABLE.
SECTION 9: INTRODUCING POWER BI SERVICE
Introducing Power BI Service
Quick Tour of the Interface
Building Blocks of PBI Service
SECTION 9.1: CONNECTING TO DATA
Data Connecting Options
Loading Local Data to a Workspace
Centralizing Data Cleansing with Dataflows
Centralizing Data with Shared Datasets
SECTION 9.2: ADMINISTERING THE POWER BI
SERVICE
Overview of Workspace Administration
Designing Workspace Structures
Workspace Creation
Workspace Settings
Assigning Workspace Roles
Using Deployment Pipelines
Understanding Data Gateways
Granting Access to Datasets
SECTION 9.3: REFRESH SCHEDULES & CONTENT
ADMINISTRATION
Creating Refresh Schedules
Implementing Incremental Refresh
Creating Subscriptions
Configuring Data Alerts
On premises gateway configuration SECTION 9.4:
SHARING ADMINISTRATION
Publishing & Updating App
Using Publish to Web
Giving Access to External Users
Allowing Users to Export Reports
SECTION 9.14: BUILDING PAGINATED REPORTS
Installing Power BI Report Builder
Create a blank report
Configure the report header
Create a data source and dataset
Configure the report parameter
Add textboxes to report header region
Add a table to the report
Format the table data region
Finalize the report design
SECTION 10: INTEGRATING AI AND MACHINE LEARNING WITH
POWER BI
Explore features such as anomaly detection, smart
narratives, Q&A visuals, and the decomposition
tree
Learn how to use AI and machine learning to create
more powerful and insightful reports and
dashboards.
SECTION 11: DAX QUERY
DEFINE: Specify a concept or term within a
context
EVALUATE: Assess the performance or significance of
a process or data
MEASURE: Quantify the extent or value of a specific
attribute
ORDER BY: Command to sort data in a specified
sequence
START AT: Indicate the initial position within a
sequence or process
VAR: Declare, assign, or manipulate a
variable
COLUMN: Vertical arrangement of data in a table or
spreadsheet
TABLE: Define or reference a structured set of
data.
SECTION 12: POWER BI HANDS-ON REAL-WORLD
PROJECTS LIST
Sales and Revenue Analysis
Human Resources Analytics
Social Media Analytics.
SECTION 13: POWER BI INTERVIEW ESSENTIALS
Common Interview Questions: Prepare for typical
Power BI interview queries
Resume Building: Learn strategies to highlight Power
BI ability on your resume effectively
Career Path Exploration: Explore various Power BI
career paths for informed professional
decisions
Networking Strategies: Develop effective networking
skills within the Power BI community.
Portfolio Development: Create a compelling Power BI
portfolio to highlight practical skills and
accomplishments.
Based on 3 reviews

Lavdeep, the Chief Mentor at Analystmate Academy, Situated in Greater Noida, Analystmate Academy offers comprehensive online training in data analytics, business intelligence, and data visualization.
He brings industry expertise honed at top corporations like Adobe, Info Edge, Mankind, Tata (TTSL), and Chrome DM.With nearly 9 years of industry experience and a proven track record of success, Lavdeep has helped over 100 people switch from non-IT careers to data analytics jobs.
Lavdeep is passionate about sharing his knowledge and empowering others with data skills. He spends his weekends conducting online Power BI and Excel training sessions, designed to be super-efficient and get you job-ready in the quickest time possible.
He is certified by Microsoft in Excel, Power BI, Azure, and Power Platform. He has also worked as a data analyst, MIS executive, business analyst, and Data Engineer, giving him a deep understanding of the data analytics field.
Lavdeep has received more than 100+ positive reviews across many learning platforms like Superprof, Urbanpro, and Teacheron.
Don't wait any longer to start your data analytics journey. Contact Lavdeep today for a free consultation!.
What Students say about us ?
"Best Teacher. Lavdeep made PowerBI understandable. Great learning experience and insightful tips. Highly appreciate the guidance."

"Excel Guru. Lavdeep saved me multiple times with quick and helpful solutions to Excel formula queries."
"Excel Formula Expert. Lavdeep solved my Excel formula issue in just 10 minutes. Great job!"
"Amazing Teacher. Lavdeep provided a quick and right solution to my job project. Grateful for finding a platform for work-related problems."
"Best Teacher for Advanced Excel. Lavdeep is an analytic mind, excellent for Business Intelligence analysis. Highly recommend his logical and understandable teaching approach."
"Data Ninja & Excel Expert. Thanks to Lavdeep for making me proficient in Microsoft Excel & Power BI. A valuable addition to my skill set."
Course duration is 90 Days having all Live sessions. Every week 2 sessions.
Course duration is 90 Days having all Live sessions. Every week 2 sessions.
Course duration is 90 Days having all Live sessions. Every week 2 sessions.
Course duration is 90 Days having all Live sessions. Every week 2 sessions.


Sanjay Kapoor
Good
"Best Teacher. Lavdeep made PowerBI understandable. Great learning experience and insightful tips. Highly appreciate the guidance."
Pragati Mishra
Good
"Excel Guru. Lavdeep saved me multiple times with quick and helpful solutions to Excel formula queries."
Aman Gupta
Good
"Excel Formula Expert. Lavdeep solved my Excel formula issue in just 10 minutes. Great job!"